반응형
Seaborn
: Statistical Data Visualization
확률밀도함수 PDF (Probability Desity Function)
: 데이터 셋의 분포를 나타냄
: 특정 구간에서의 확률을 나타냄
선의 확률은 0
키가 170일 확률 = 0
KDE(Kernel Density Estimation)
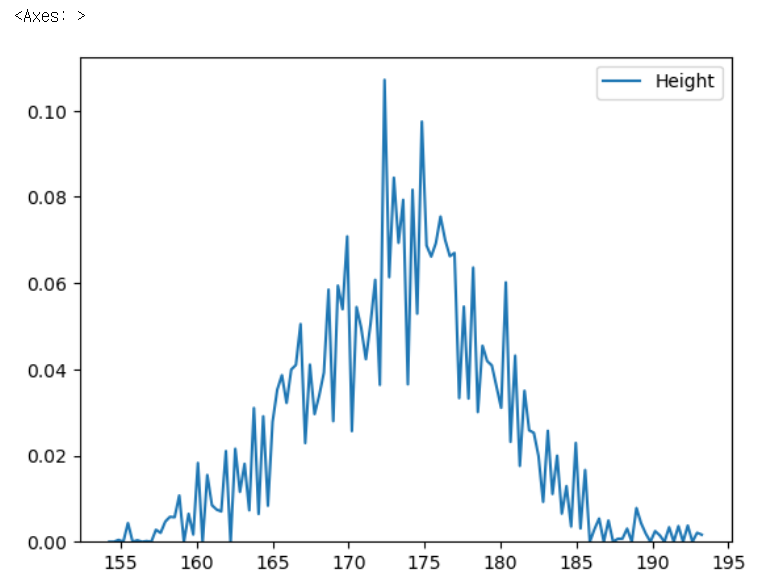
: 우리가 갖고 있는 데이터는 굴곡이 많은 데이터임
: KDE를 사용해 굴곡 많은 데이터를 추측을 통해 진짜 분포에 가깝게 부드러운 곡선으로 바꿀 수 있음
키 몸무게 데이터 가져오기
body_df = pd.read_csv('./data/body.csv', index_col=0)
body_df.head()
데이터 정렬
body_df['Height'].value_counts().sort_index()

그래프 그리기
body_df['Height'].value_counts().sort_index().plot()
Seaborn KDE 그래프
sns.kdeplot(body_df['Height'], bw=0.05) # bw = 추측수준 (구간 나누는 갯수)
bw 파라미터 값 조정
sns.kdeplot(body_df['Height'], bw=5) # bw = 추측수준 (구간 나누는 갯수)
키 몸무게 데이터 가져오기
body_df = pd.read_csv('./data/body.csv', index_col=0)
body_df.head()
히스토그램 그래프
body_df.plot(kind='hist', y='Height',bins=15)
Seaborn distplot
sns.distplot(body_df['Height'], bins=15)
박스플롯
# 박스 플롯
body_df.plot(kind='box', y='Height')
- 위스커 부분 : Q3위/ Q1아래 점

바이올린 플롯
- 시각적 근사함
- 특정 데이터에서 바이올린 모양
- 데칼코마니
- 90º 돌려 확인하면 히스토그램 모양
# 바이올린 플롯
sns.violinplot(y=body_df['Height'])

Scatter plot
body_df.plot(kind='scatter', x='Height', y='Weight')
등고선 kdeplot
# 등고선
sns.kdeplot(body_df['Height'], body_df['Weight'])
- x축 키 : 가로 간격 / y축 몸무게 : 세로 간격
- 여기서는 가로데이터(Height)는 175cm 부근에 집중적으로(뾰족) 많음
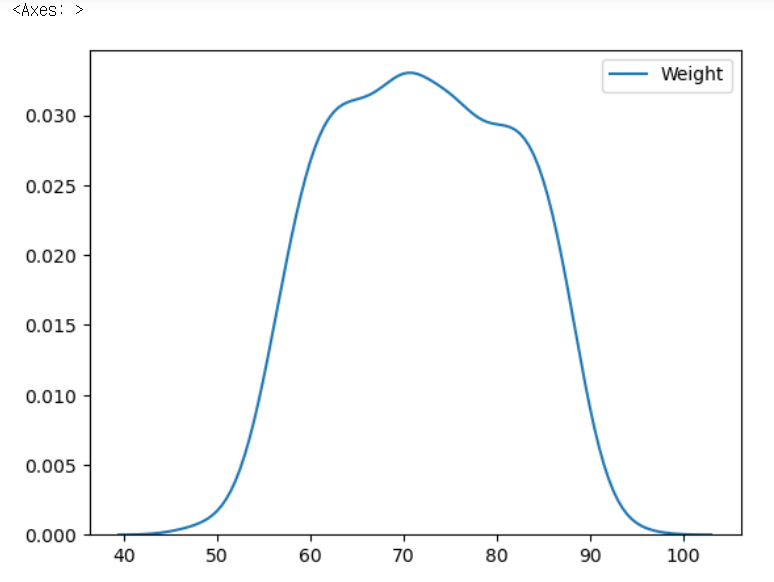
- 세로데이터(Weight)는 65~75 부근까지 비교적 평평하게 많음
- 가파를수록 선끼리 가까워짐
가로데이터(Height)
sns.kdeplot(body_df['Height'])
세로데이터(Weight)
sns.kdeplot(body_df['Weight'])

## 윗부분에서 좀 평평?
반응형
'Python > Seaborn' 카테고리의 다른 글
| [Seaborn] EDA (0) | 2024.01.09 |
|---|---|
| [Seaborn] LM Plot, Cat Plot (0) | 2024.01.08 |