반응형
EDA(Exploratory Data Analysis)
: 주어진 데이터를 다양한 관점에서 탐색하며 인사이트를 도출
- row의 의미
- column의 분포
- 여러 column간 연관성
기본정보 데이터 불러오기
import pandas as pd
import seaborn as sns
%matplotlib inline

df = pd.read_csv('./data/young_survey.csv')
df.head()

basic_info = df.iloc[:, 140:]  # 마지막 7개 column
basic_info.head()
- 성별 / 우세 손 / 학벌 column 요소별 갯수
basic_info['Gender'].value_counts()
basic_info['Handedness'].value_counts()
basic_info['Education'].value_counts()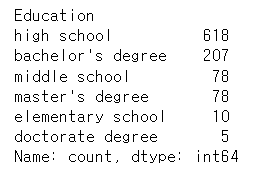
- 성별 and 나이 and 우세손 관계
sns.violinplot(data=basic_info, x='Gender', y='Age', hue='Handedness')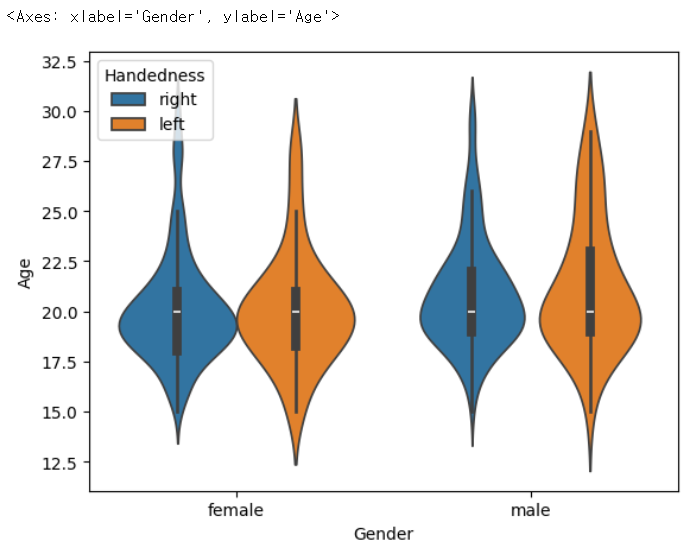
- 성별 간 키 몸무게 분포
sns.jointplot(data=basic_info, x='Height', y='Weight', hue='Gender')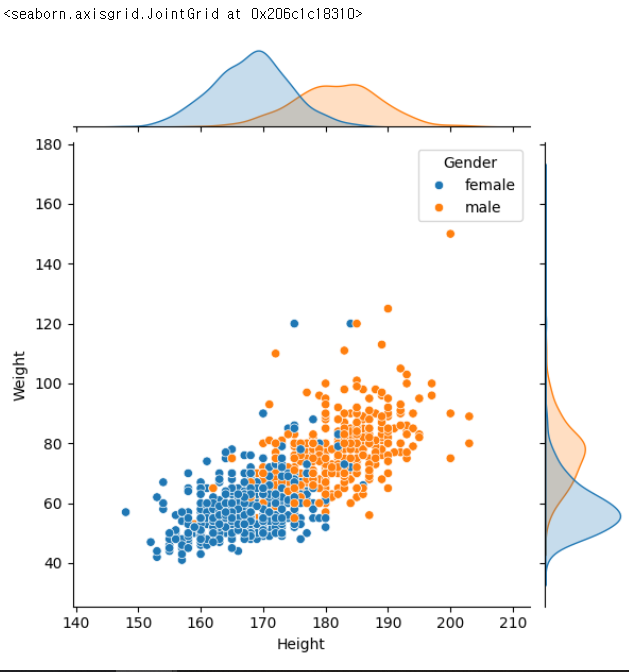
음악 관련 데이터 불러오기
music_df = df.iloc[:, :19]
music_df.head()
- 음악 관련 히트맵
sns.heatmap(music_df.corr())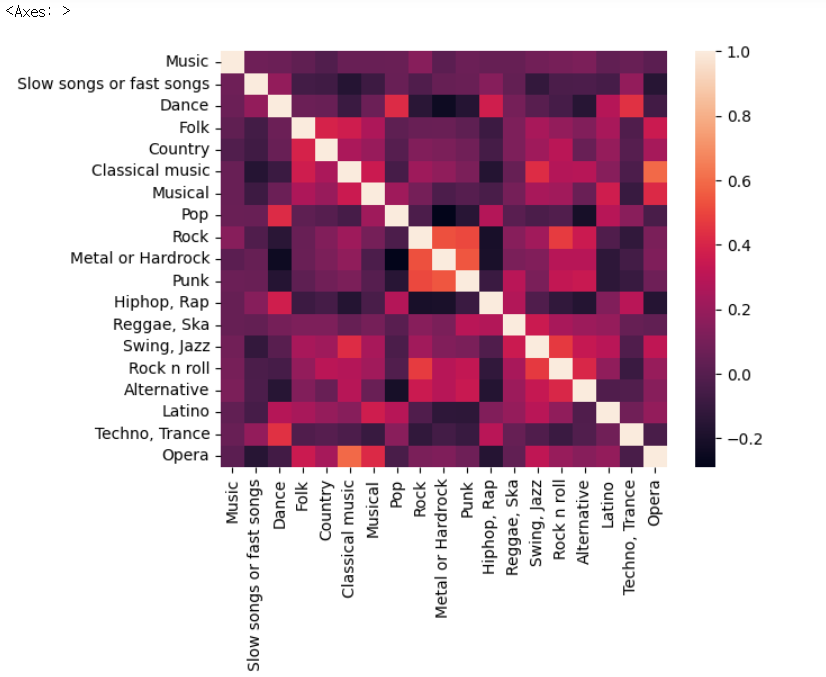
- 나이와 직접적으로 연관있는 column 상관계수
df.corr(numeric_only=True)['Age'].sort_values(ascending=False)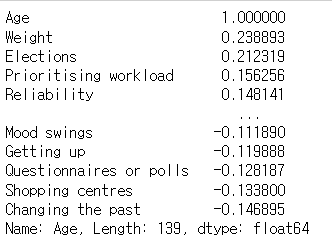
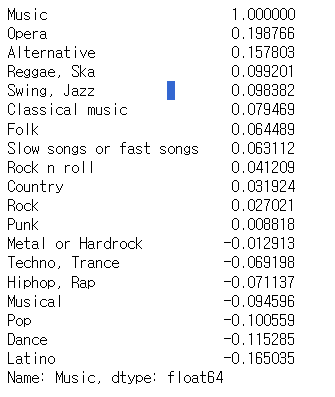
- 일찍 일어나는 사람이 좋아하는 음악 장르
early_waker = df['Getting up'] == 1
df.iloc[:,:19][early_waker].corr(numeric_only=True)['Music'].sort_values(ascending=False)
※ corr() 사용할 때 에러가 생기는 경우

→ numeric_only=True를 사용
Cluster Analysis
: 데이터를 몇 가지 부류로 분류
- 관심사 데이터 출력
interests = df.loc[:, 'History':'Pets']
interests.head()
- 역사와 관련된 관심사들의 상관계수
corr = interests.corr()
corr["History"].sort_values(ascending=False)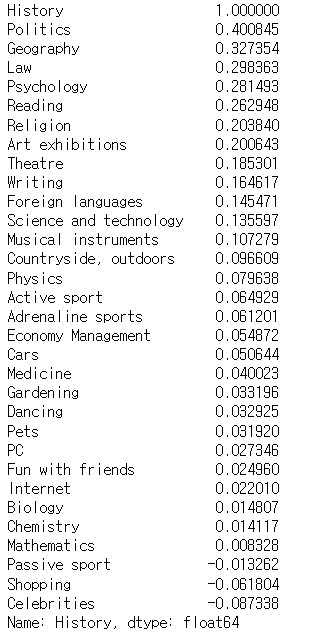
- clustermap으로 그리기
sns.clustermap(corr)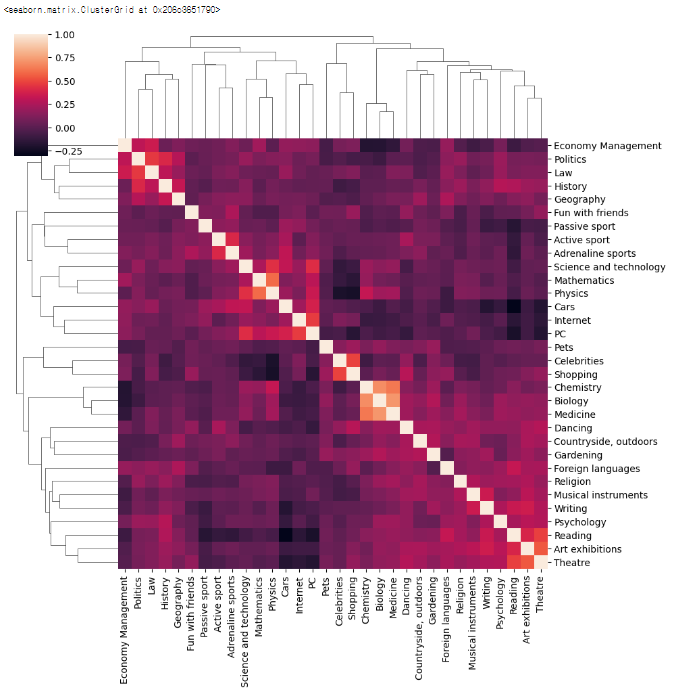
반응형
'Python > Seaborn' 카테고리의 다른 글
| [Seaborn] LM Plot, Cat Plot (0) | 2024.01.08 |
|---|---|
| [Seaborn] KDE (0) | 2024.01.05 |