갖추어야 할 조건
: 완결성 / 유일성 / 통일성 / 정확성
완결성 (Completeness)
: 필수정보가 누락됨이 없이 전부 존재해야 함
NaN 값이 있는 데이터
df = pd.read_csv('./data/attendance.csv', index_col=0)
print(df, end='\n\n')

결측값 합계 isnull()
print(df.isnull().sum(), end='\n\n')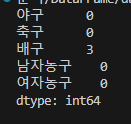
dropna(행)
df.dropna(inplace=True)
print(df, end='\n\n')
dropna(column)
df.dropna(axis='columns', inplace=True)
print(df, end='\n\n')
NaN을 0으로 대체
df.fillna(0, inplace=True)
print(df, end='\n\n')

NaN을 평균값으로 대체
df.fillna(df.mean(), inplace=True)
print(df, end='\n\n')
NaN을 중간값으로 대체
df.fillna(df.median(), inplace=True)
print(df, end='\n\n')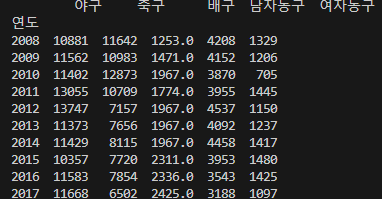
유일성(Uniqueness)
: 동일한 데이터가 중복되면 안됨
- 한 데이터를 수정할 때, 다른 데이터를 수정하지 못하면 문제발생 함.
ex) 회원가입을 다시할 때
데이터 출력
df = pd.read_csv('./data/dust.csv', index_col=0)
print(df.head(), end='\n\n')
인덱스 출력
print(df.index)

인덱스 갯수 출력
print(df.index.value_counts())
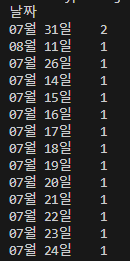
중복 데이터 출력
print(df.loc['07월 31일'])
중복 row 제거
df.drop_duplicates(inplace=True)
print(df.index.value_counts())
중복 column 제거
- 행 열 치환
print(df.T)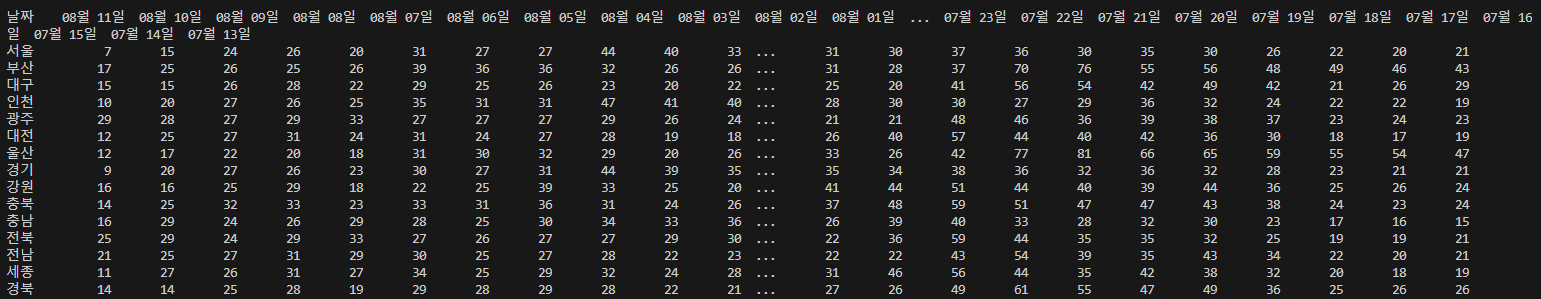
- 강원.1 제거
df = df.T.drop_duplicates().T
print(df)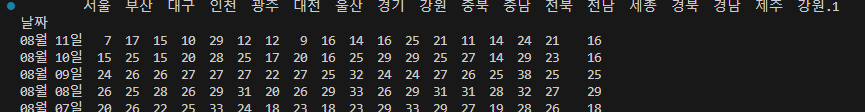

통일성 (Conformity)
: 데이터가 동일한 형식으로 저장되야함
- 데이터 타입 / 단위 / 포멧
- 가격의 콤마 여부 / 단위 표시 여부 / 시간 단위 or 분 표시
정확성 (Accuracy)
: 데이터가 정확해야함
- 주로 데이터를 모으는 과정에서 발생
키 측정 시 : 신발을 신고 측정 and 신발을 벗고 측정
- 이상점(Outlier)
: 다른 값들과 너무 동떨어져 있는 데이터
Q. 이상점을 측정하는 방법?
A. 정해진 것 없음.
→ 보통 boxplot에서 25% 지점의 1.5배 아래로 벗어난 지점 and 75% 1.5배 이상 위로 벗어난 지점
→ 고치거나 지워야함.
→ 의미 있을 수도 방해가 될 수도 있다.
데이터 가져오기
%matplotlib inline
import pandas as pd
df = pd.read_csv('./data/beer.csv', index_col = 0)
df.head()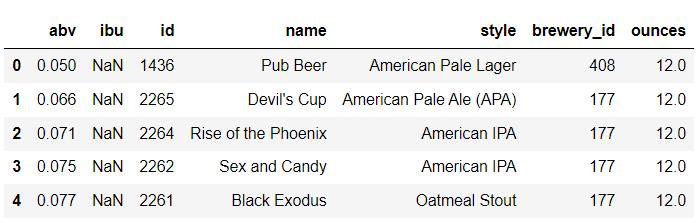
boxplot 출력
df.plot(kind='box', y='abv')
Q1, Q3 지점 확인
# 25% , 75% 지점 확인
df['abv'].describe()
- qunantile( ratio )
df['abv'].quantile(0.25)  # 0.05
df['abv'].quantile(0.75)  # 0.065
IQR 값 구하기
q1 = df['abv'].quantile(0.25)
q3 = df['abv'].quantile(0.75)
iqr = q3 - q1
이상치의 기준
cond = (df['abv']< q1 - 1.5*iqr) | (df['abv']>q3 + 1.5*iqr)

df[cond]
- 3번째 데이터는 'abv' 값이 1/100 되야함.
이상치 값 고치기
df.loc[2250, 'abv'] = 0.055
df.loc[2250]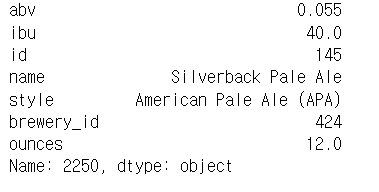
다시 이상치 출력
cond = (df['abv']< q1 - 1.5*iqr) | (df['abv']>q3 + 1.5*iqr)
df[cond]
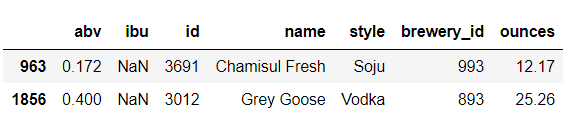
나머지 이상치들은 제거
- 맥주아닌 소주 / 보드카임
df[cond].index
df.drop(df[cond].index, inplace=True)
cond = (df['abv']< q1 - 1.5*iqr) | (df['abv']>q3 + 1.5*iqr)
df[cond]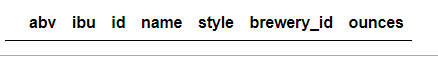
boxplot 재출력
df.plot(kind='box', y='abv')
이상치 제거 2 데이터 가져오기
df = pd.read_csv('./data/exam_outlier.csv')
df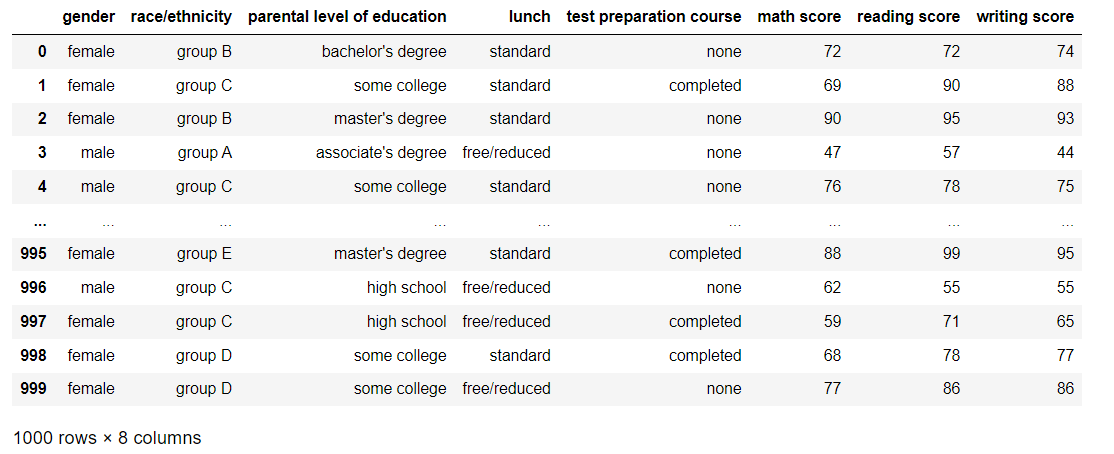
데이터 시각화
import matplotlib.pyplot as plt
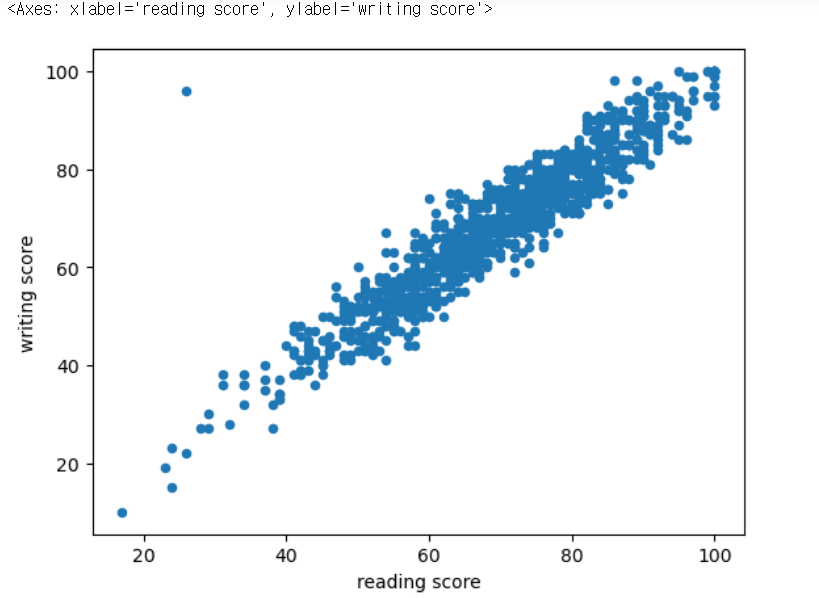
plt.scatter(df['reading score'], df['writing score'])
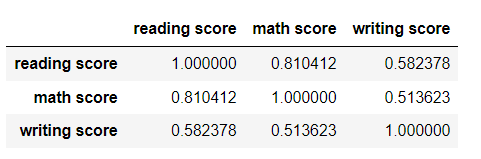
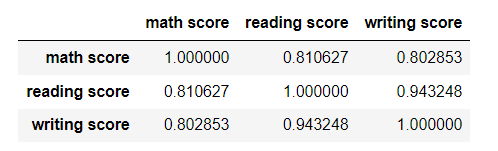
점수별 상관계수
df[['reading score', 'math score', 'writing score']].corr()- 쓰기와 수학 상관관계 너무 낮음
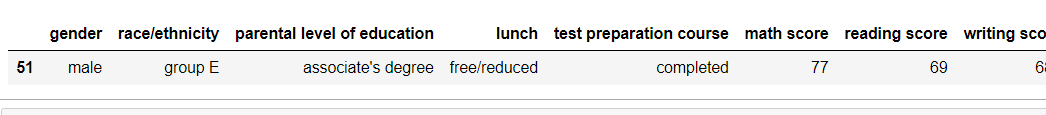
이상치 값 출력
df[df['writing score']>100]
이상치 제거 및 다른 이상치 보임
df.drop(51, inplace=True)
df.plot(kind='scatter', x='reading score', y='writing score')
향상된 상관계수 값
df[[ 'math score', 'reading score', 'writing score']].corr()
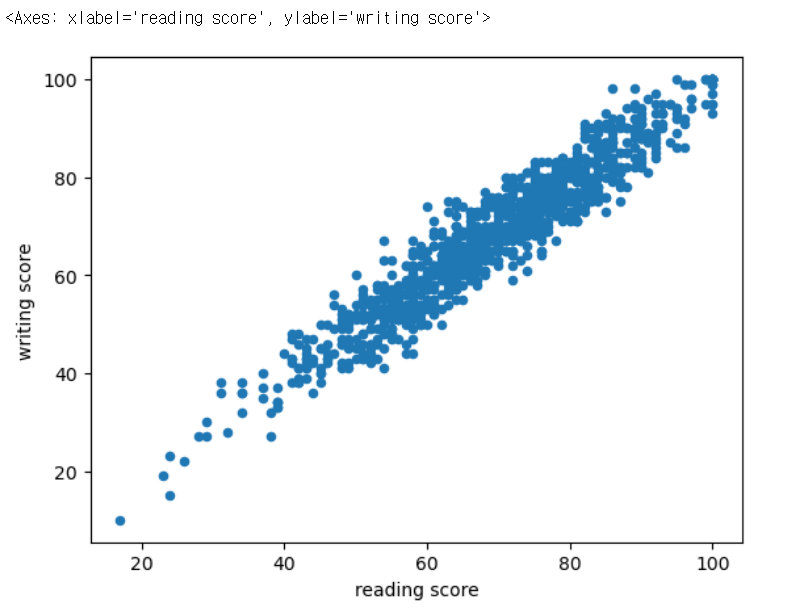
다른 이상치 제거
df.drop(373, inplace=True)
df.plot(kind='scatter', x='reading score', y='writing score')
- reading 시험을 답안지 밀려썼을 수도??
향상된 writing - reading 상관계수
df[['reading score', 'math score', 'writing score']].corr()
'Python > Pandas' 카테고리의 다른 글
| [Pandas] groupby 카테고라이징 (0) | 2024.01.22 |
|---|---|
| [Pandas] 문자열 필터링 (0) | 2024.01.16 |
| [Pandas] DataFrame 큰 데이터 살피기 (0) | 2024.01.02 |
| [Pandas] DataFrame index/column (2) | 2024.01.02 |
| [Pandas] DataFrame 값 쓰기 및 삭제 (0) | 2024.01.01 |